
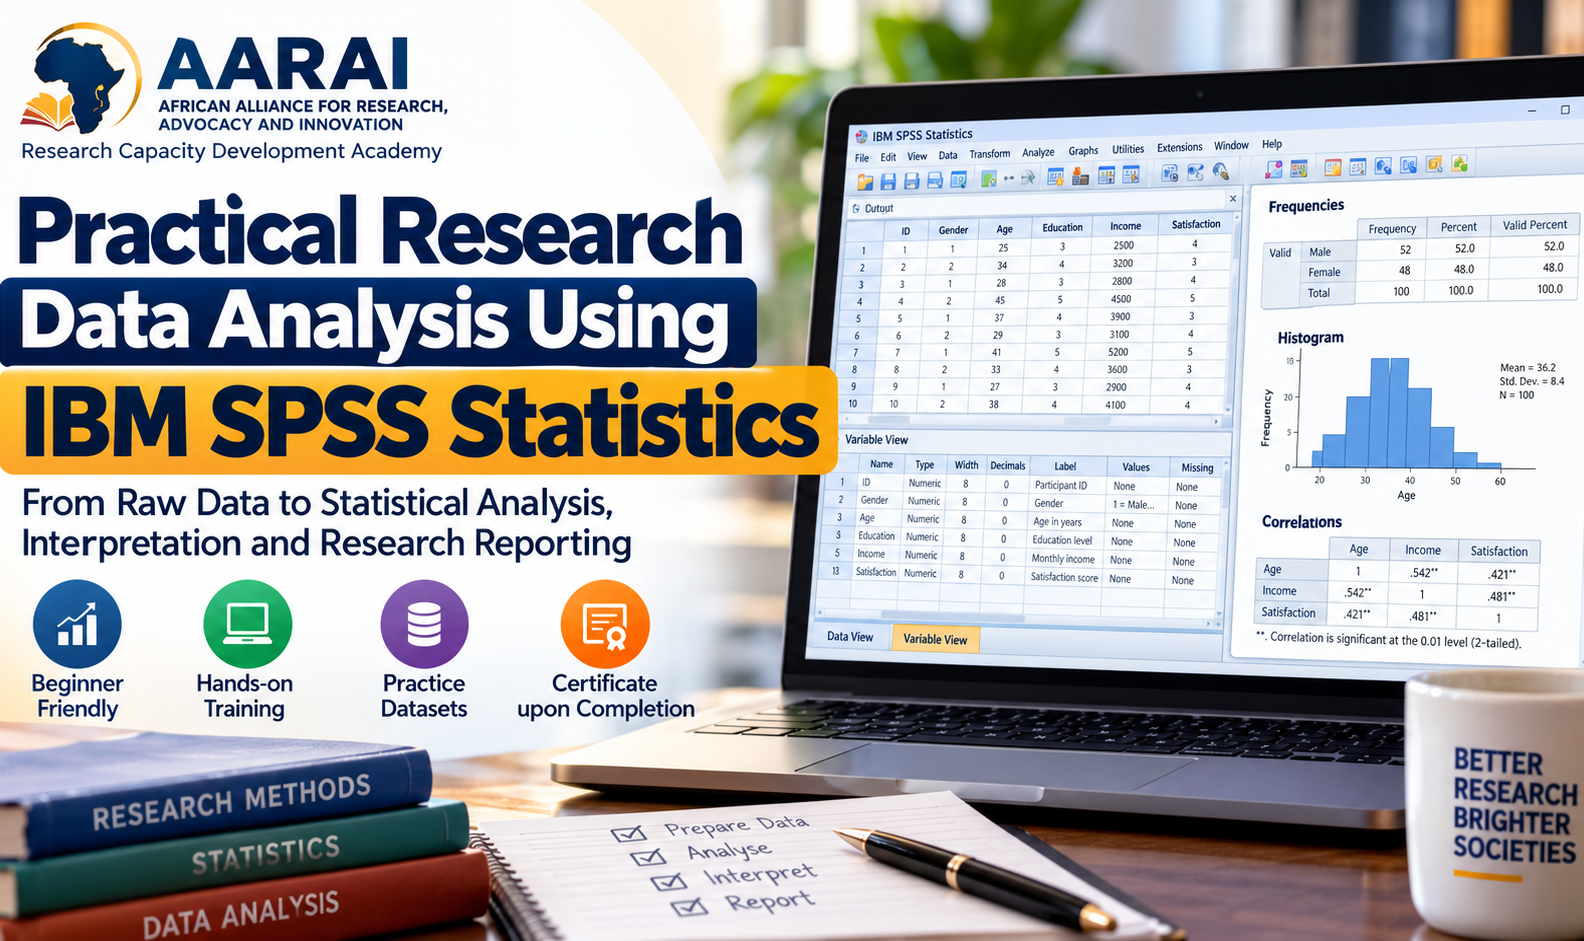
Practical Research Data Analysis Using IBM SPSS Statistics

- 2 Sections
- 4 Lessons
Getting started
Module 1: Introduction to SPSS and Statistical Data
From Raw Data to Statistical Analysis, Interpretation and Research Reporting
Are you a student, postgraduate researcher, academic, health professional, or emerging researcher who wants to analyse research data confidently? Do you find it challenging to choose the right statistical test, organise datasets, interpret statistical output, or present findings in a thesis or journal article?
The Practical Research Data Analysis Using IBM SPSS Statistics course is designed to help you develop the knowledge and practical skills needed to transform raw research data into meaningful, accurate, and well-presented findings.
Offered by the AARAI Research Capacity Development Academy, this comprehensive, self-paced online course takes you from the fundamentals of research data and statistics to the practical application of commonly used statistical techniques in IBM SPSS Statistics.
You will learn how to create and manage datasets, code variables, import data from Excel, identify data-quality problems, perform descriptive analyses, select appropriate statistical tests, interpret SPSS output, and report findings using accepted academic conventions.
The course begins with the basics, making it suitable for learners who are new to SPSS or have limited experience with statistical analysis. It then progresses to commonly used inferential techniques, including chi-square tests, independent and paired-samples t-tests, analysis of variance (ANOVA), correlation, and regression. You will also receive an introduction to reliability analysis and selected intermediate statistical methods.
Throughout the course, emphasis is placed on practical application rather than memorising statistical procedures. You will work with practice datasets, follow guided demonstrations, complete exercises, and assess your understanding through quizzes and practical activities. You will also learn how to interpret statistical results in the context of research questions rather than relying solely on p-values or statistical significance.
What You Will Learn
By completing this course, you will develop the ability to:
-
Navigate the IBM SPSS Statistics interface and understand its main features.
-
Create, code, import, organise, and manage research datasets.
-
Develop a codebook and define variables, labels, and measurement levels.
-
Identify missing values, invalid entries, outliers, and other common data-quality issues.
-
Generate frequency distributions, percentages, measures of central tendency, measures of variability, tables, and charts.
-
Understand hypotheses, significance testing, confidence intervals, and effect sizes.
-
Choose appropriate statistical procedures based on your research questions, variables, study design, and assumptions.
-
Conduct common analyses, including chi-square tests, t-tests, one-way ANOVA, correlation, and regression.
-
Understand the introductory application of Cronbach's alpha, exploratory factor analysis, and MANOVA.
-
Interpret SPSS tables and outputs accurately.
-
Prepare clear statistical tables and write results for dissertations, theses, research reports, and journal manuscripts.
-
Recognise common analytical errors and avoid unsupported conclusions.
Course Structure
The course is organised into eight progressive modules:
Module 1: Introduction to SPSS and Statistical Data
Understand the foundations of research statistics, the SPSS interface, variables, cases, measurement levels, and file management.
Module 2: Data Entry, Coding and Data Management
Learn to create datasets, develop codebooks, enter data, import Excel files, recode variables, compute new variables, and manage missing values.
Module 3: Data Cleaning and Preliminary Analysis
Identify data errors, examine missing data and outliers, explore distributions, and prepare datasets for statistical analysis.
Module 4: Descriptive Statistics and Data Visualisation
Generate frequencies, percentages, means, medians, standard deviations, cross-tabulations, and visual summaries of research data.
Module 5: Hypothesis Testing and Comparing Groups
Understand hypothesis testing and apply chi-square tests, t-tests, ANOVA, and selected non-parametric alternatives.
Module 6: Correlation and Regression Analysis
Explore relationships between variables and learn the fundamentals of correlation, linear regression, multiple regression, and introductory binary logistic regression.
Module 7: Reliability Analysis and Selected Intermediate Techniques
Understand internal consistency and Cronbach's alpha, with introductory exposure to exploratory factor analysis and MANOVA.
Module 8: Interpreting SPSS Output and Reporting Research Findings
Interpret results, understand statistical significance and practical importance, prepare research tables, and report findings using academic conventions.
How You Will Learn
This is a fully self-paced online course. You can study according to your schedule, revisit lessons, and practise the procedures at your own pace.
Learning activities include:
-
Short instructional lessons.
-
Step-by-step SPSS demonstrations.
-
Downloadable practice datasets and codebooks.
-
Guided exercises and practical assignments.
-
Module quizzes and knowledge checks.
-
A final applied data-analysis project.
The course is designed to connect statistical concepts with real research situations, particularly those encountered in public health, behavioural sciences, psychology, education, social sciences, and other applied research fields.
Final Practical Project
To consolidate your learning, you will complete a final project using a supplied practice dataset and research questions. You will prepare and examine the dataset, conduct descriptive analysis, perform at least one appropriate inferential analysis, interpret the results, and prepare a short research results report.
The project is intended to demonstrate your ability to make informed analytical decisions and communicate findings clearly. You will not need to collect new research data to complete it.
Who Should Enrol?
This course is suitable for:
-
Undergraduate and postgraduate students.
-
Master's and doctoral researchers.
-
Early-career academics and university lecturers.
-
Public health and healthcare professionals.
-
Psychology, counselling, nursing, and social science researchers.
-
Monitoring and evaluation practitioners.
-
Research assistants and data analysts.
-
Professionals seeking to strengthen their quantitative research skills.
No advanced statistical background is required. A willingness to learn, practise, and engage with research data is essential.
What You Need
You will need a computer, internet access, and access to a compatible installation of IBM SPSS Statistics. A basic understanding of research concepts will be helpful, but the course introduces the essential statistical foundations as you progress.
Please note that an SPSS software licence is not included in the course fee unless explicitly stated.
Assessment and Completion
Your progress will be assessed through module quizzes, guided practical activities, and the final data-analysis project. Successful completion will depend on meeting the course assessment requirements.
Begin Your Data Analysis Journey
Statistical analysis is more than producing tables and obtaining significant p-values. It involves asking the right questions, selecting suitable methods, interpreting evidence responsibly, and communicating findings in ways that support knowledge and decision-making.
Join the AARAI Research Capacity Development Academy and take a practical step towards becoming a more confident, independent, and competent researcher.
Learn. Practise. Analyse. Interpret. Make an impact.
AARAI Research Capacity Development Academy
African Alliance for Research, Advocacy and Innovation (AARAI)
Advancing Knowledge. Transforming Lives.
Want to submit a review? Login
Related Courses
Research Bootcamp: From Research Idea to Research Proposal
Six structured modules covering the research process from idea to proposal
Learn to develop focused, feasible, and researchable topics
Master literature searching and preliminary research gap identification